Pull Request Flow & Code Review Efficiency
Today we’re announcing two new dashboards that give engineering managers a full picture of how delivery flows, and how code gets reviewed along the way.
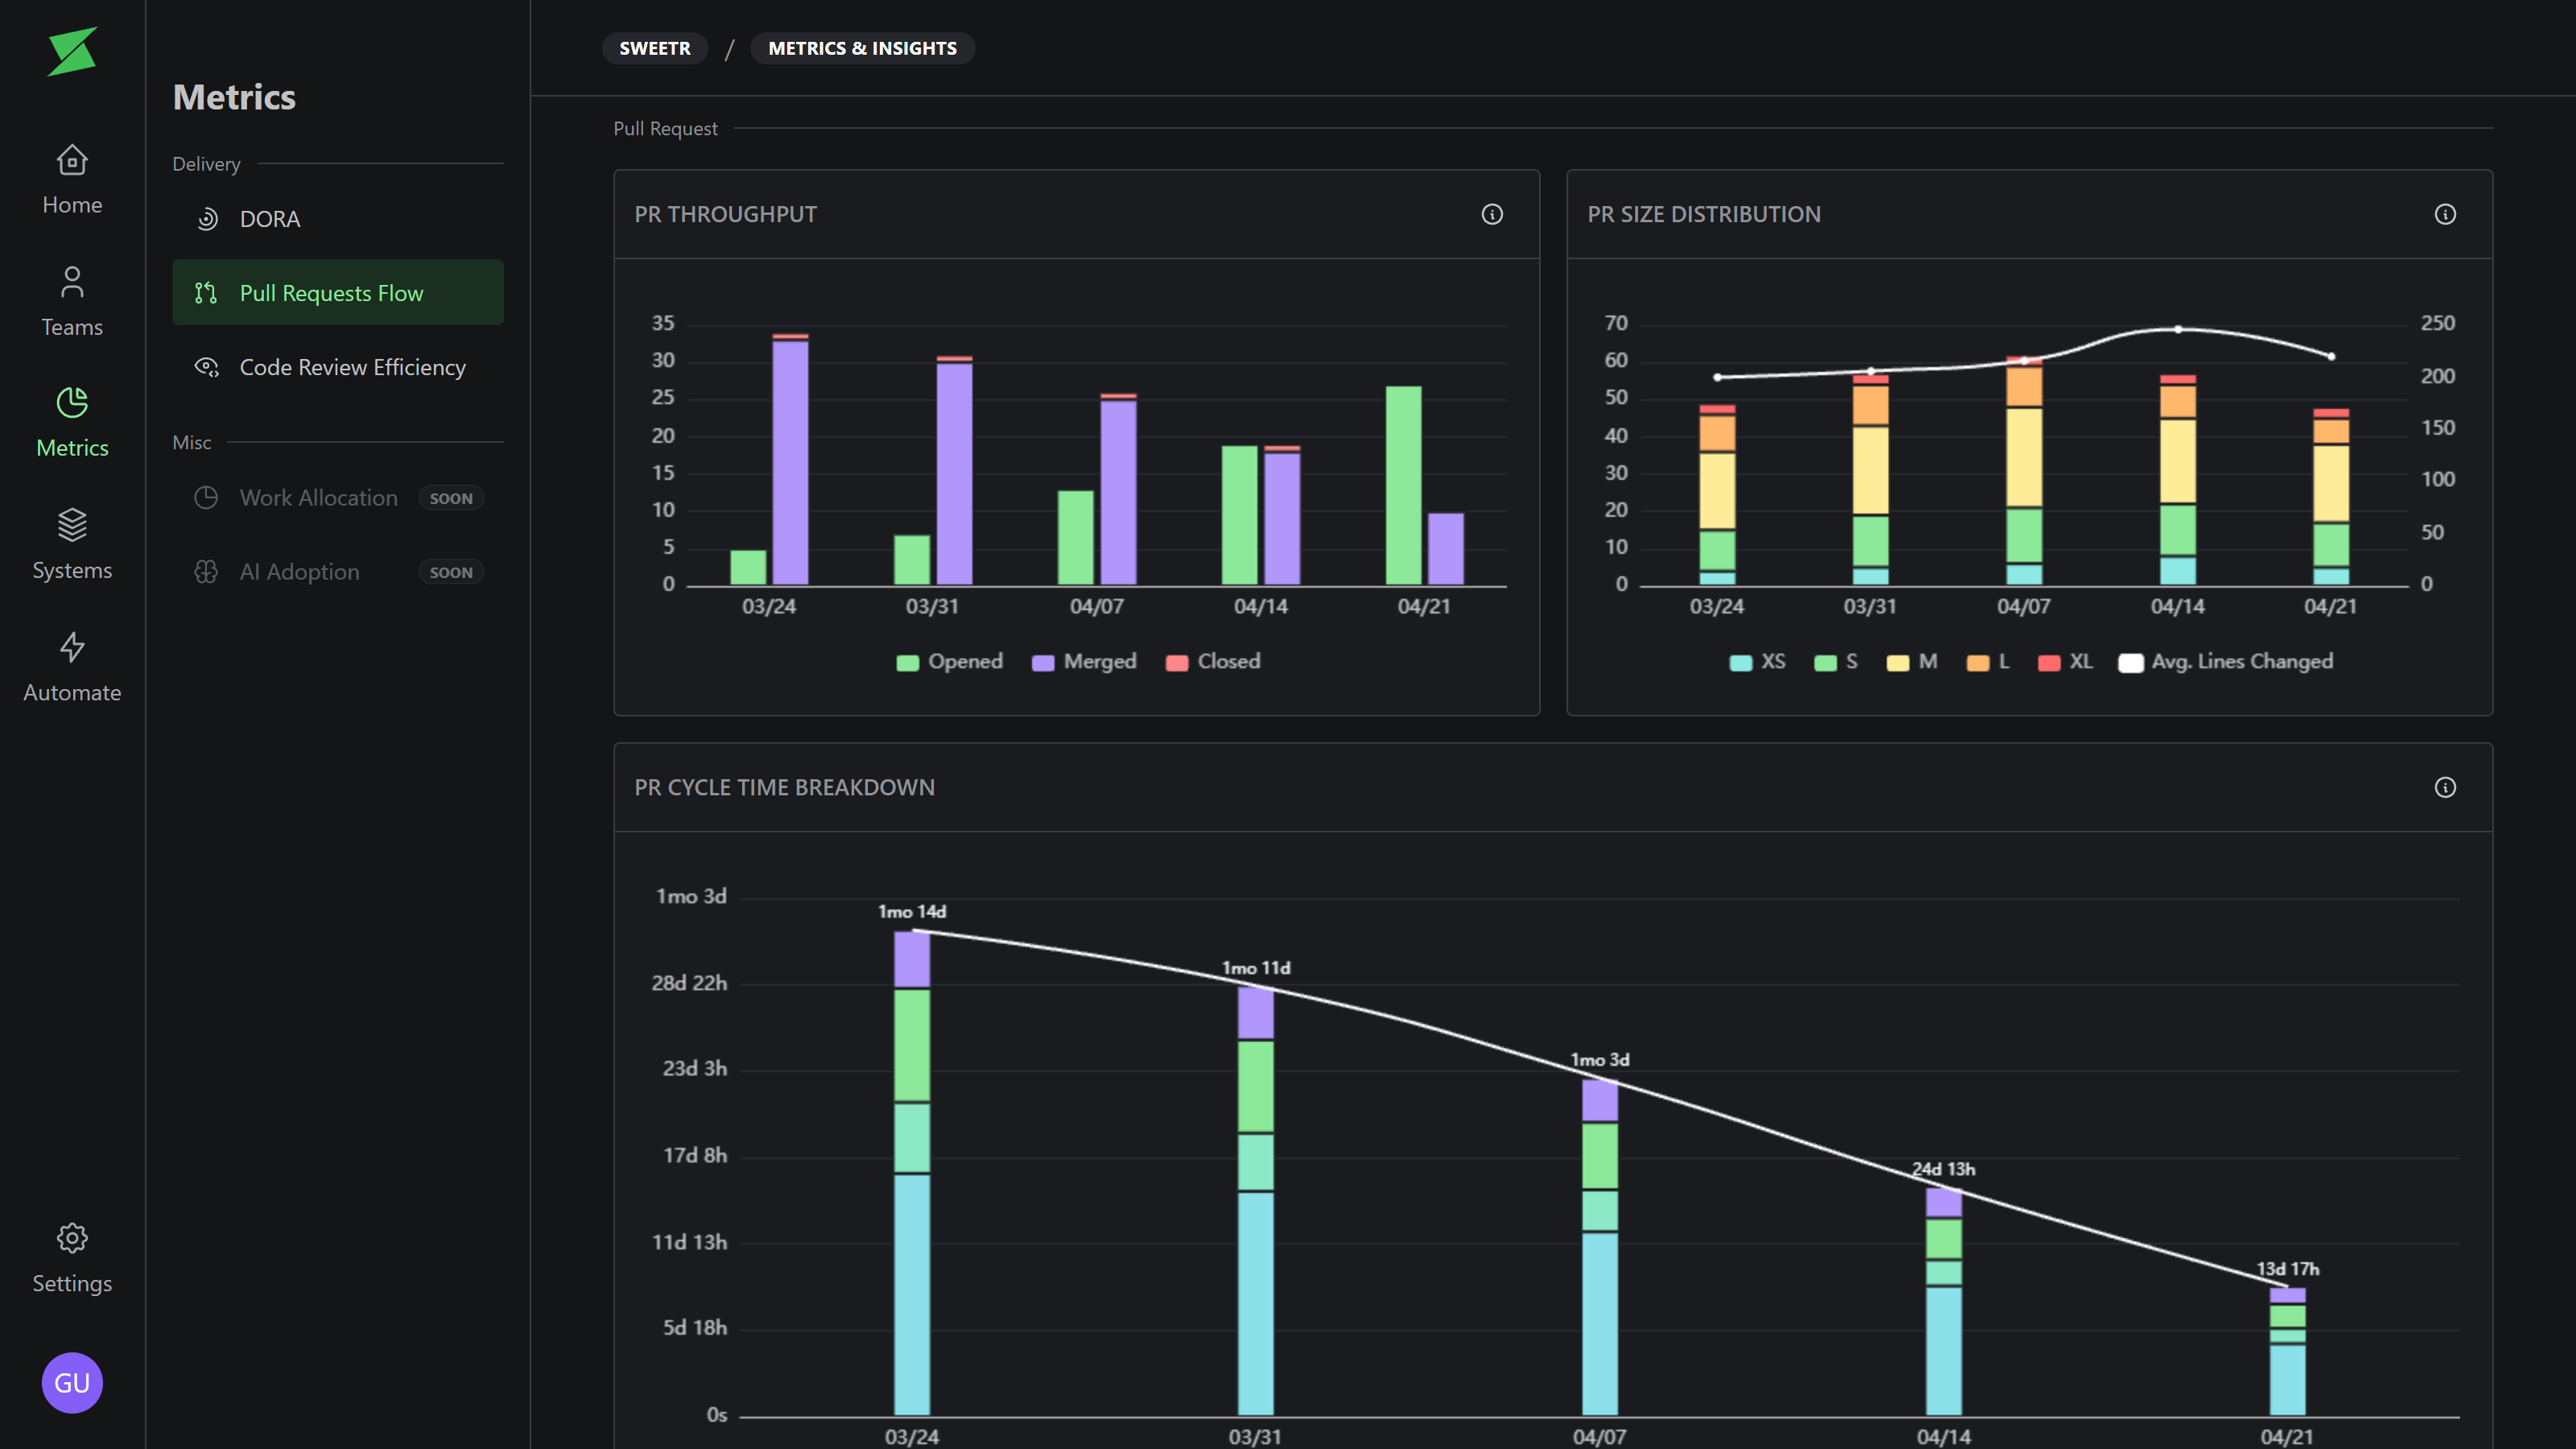
Pull Request Flow
PR throughput, size distribution, and avg lines changed.
Cycle time broken down by coding, first review, approval, and merge.
PR size vs cycle time, to see where big PRs hurt flow.
Team-by-team comparison of cycle time and PR size.
Code Review Efficiency
Time to first review, time to approve, and merges without approval. With trend vs previous period.
A map of who reviews whose code.
Split between team reviews and cross-team reviews.
Review speed per team.
PR size vs comments, to spot PRs that overwhelm reviewers.
Use them to find the stage slowing delivery, rebalance review load, and bring real data into retros and 1:1s.